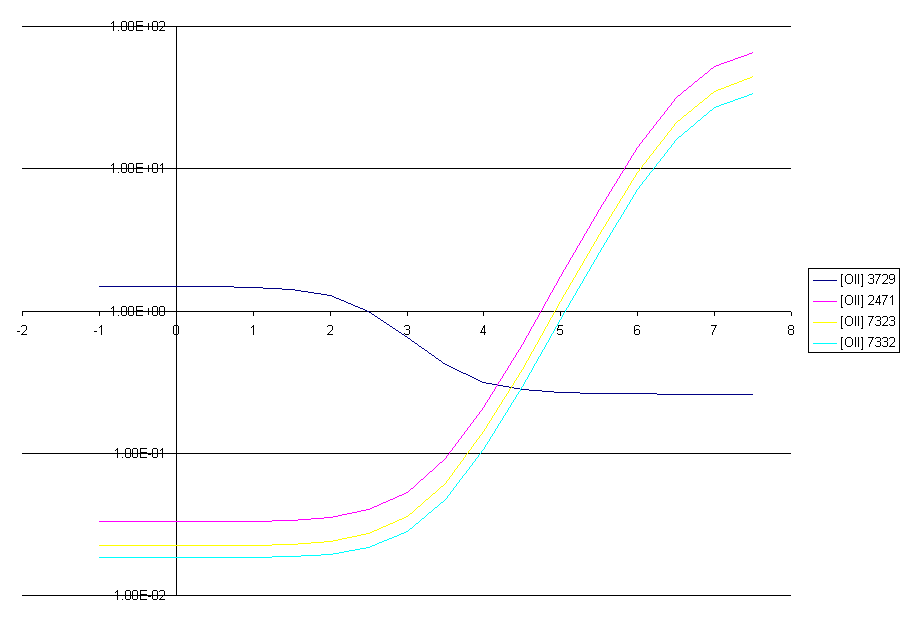
This is a series of calculations in which the density is varied, and the intensities of some [OII] lines relative to [OII] 3727 are printed. The plot shows two density-sensitive ratios.

The x-axis is the log of the electron density (cm-3) and the y-axis is the intensity of the line relative to [OII] 3727.
last modified 19 July, 2008